Chia-Hung Chen, Shi-Gun Pan, Peter Kinget
CAUTION: Be very careful when you measure signals on humans. Carefully read and apply the necessary safety procedures! We cannot be held responsible for any harm caused by using any of the circuits or procedures described on this site. We also do not claim any of the circuits or procedures are safe. Use at your own risk.Contents
1. Introduction to ECG measurement system
1.
Introduction to ECG measurement system
The ECG system is shown on Figure 1. The ECG system comprises four stages, each stage is as following:
(1) The first stage is a transducer—AgCl electrode, which convert ECG into electrical voltage. The voltage is in the range of 1 mV ~ 5 mV.
(2) The second stage is an instrumentation amplifier (Analog Device, AD624), which has a very high CMRR (90dB) and high gain (1000), with power supply +9V and -9V.
(3) We use an opto-coupler (NEC PS2506) to isolate the In-Amp and output.
(4) After the opto-coupler is a bandpass filter of 0.04 Hz to 150 Hz filter. It’s implemented by cascading a low-pass filter and a high pass filter.
Figure 1 Function blocks of the ECG system
The basic structure of the heart is shown on Figure 2. Measuring at different region of the heart will retrieve different biopotential. And, so that it will generate different ECG waveforms. The ECG generated by each cardiac cycle is summarized on Table 1.
Figure 2 Basic structure of the heart. RA is the right atrium, RV is the right ventricle; LA is the left atrium, and LV is the left ventricle.
|
Event |
Characteristics |
Duration at 75 bpm (0.8 second
cycle) |
|
Atrial diastole Ventricular diastole |
AV valves opened. Semilunar valves close. Ventricular filling. |
0.4 seconds |
|
Atrial systole Ventricular diastole |
AV valves open. Semilunar valves closed.
Ventricular filling. |
0.1 seconds |
|
Atrial diastole Ventricular systole |
AV valves closed. Semilunar valves open. Blood pumped into aorta and
pulmonary artery. |
0.3 seconds |
Table 1 Duration and characteristics of each major event in the cardiac cycle.
The ECG is converted into electrical voltage by electrodes. A typical surface electrode used for ECG recording is made of Ag/AgCl, as shown on Figure 3. The disposable electrodes are attached to the patients’ skin and can be easily removed.
Figure 3 A disposable surface electrode.
The cardiac mechanism of ECG is shown on Figure 4. In the top figure, the electrocardiogram (ECG) initiates the cardiac cycle. The cardiac sounds are also shown. The bottom figure shows that ejection occurs when the pressure in the left ventricle exceeds that in the arteries.
Once the electrodes convert the ECG into electrical voltage, these voltage can be fed into an instrumentation amplifier, and then be processed.

Figure 4 The ECG cardiac cycle.
We measure the ECG by connecting two electrodes on the right and left chest respectively, as shown on Figure 5. The body should be connected to ground of the circuits, so that we connect the leg to the ground. If the body is not grounded, no signal would be obtained.
Figure 5 Simplified ECG recording system
The ECG circuit diagram is shown on Figure 6.
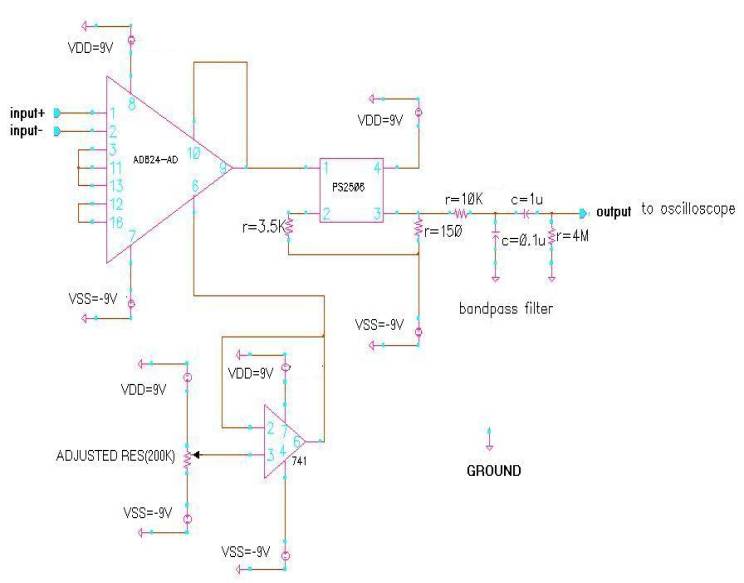
Figure 6 The ECG circuit diagram
We choose Analog Device AD624 instrumentation amplifier to amplify the ECG voltage from electrodes, which is in the range of several mV.
The AD624 is set up with gain of 1000, and is supplied by +9 V and -9V
battery power. Some important
features of the AD624 are listed on Table 2.
|
Supply Voltage |
+-9V
Battery power |
|
Programmable Gain |
1, 100, 200, 500, 1000, 2500 |
|
CMRR |
130dB (Gain=500 to 1000) |
|
Gain Bandwidth Product |
25 MHz |
|
Input offset |
25 μV, max |
Table 2 Important features of AD624 Instrumentation Amplifier
A very high CMRR is very essential for Instrumentation Amplifier. The small ac signal voltage (less than 5 mV) detected by the sensor on the electrodes will be accompanied by a large ac common-mode component (up to 1.5 V) and a large variable dc component (300 mV). The common-mode rejection specified by the AAMI (Association for the Advancement of Medical Instrumentation) is 89 dB minimum for standard ECG and 60 dB minimum for ambulatory recorders. The CMRR of AD624 with gain of 1000 is shown on Figure 7. The equation of the CMRR:
CMRR = differential gain / common mode gain = Adm/Acm
Figure 7 Measured CMRR data of AD624 In-Amp
A 741-Opamp is connected to the reference node (node 6) of AD624 to offset the output DC voltage to 3V (on page 10, AD624 data sheet [2]). The 741 is connected as a source follower. The output DC voltage of the AD624 is adjusted to 3V, which is an optimal value after many try and errors.
The data sheet of ST 741 Op Amp is on [3].
After the In-Amp, a NEC PS2506 opto-coupler is cascaded to isolate the In-Amp from the rest of circuits, as shown on Figure 6. The datasheet of the NEC PS2506 is on [4].
In general, components of the signal of interest will reside in the 0.67 to 40-Hz bandwidth for standard ECGs and up to 300 Hz to 1 kHz for pacemaker detection. We take the suggestion by the book of John Webster [1] to have the bandpass filter the frequency range of 0.04 Hz ~ 150 Hz. The filter is implemented by cascading a low-pass filter and a high-pass filter. The data of low-pass and high-pass filter are implemented by simple RC components, as shown on Table 3. The measured transfer function of the bandpass filter is on Figure 8.
|
|
R |
C |
Time
Constant t |
3dB
Frequency |
|
Low-Pass
Filter |
4
MW |
1
mF |
4.0
sec |
0.04
Hz |
|
High-Pass
Filter |
10
KW |
0.1
mF |
0.001
sec |
159
Hz |
Table 3 Filter data
Figurer 8 The measured transfer function of the bandpass filter
The ECG circuit is shown on Figure 9. We use the Agilent 54624 Oscilloscope to probe the ECG signal.
The three measured ECG signals, on Figure 10, are respectively from the Instrumentation Amp, opto-coupler, and filter. The circuits function very well so that the three signals are almost identical to each other.
Measuring different region of the heart will obtain different ECG signals. The ECG signal shown on Figure 9 is one of the standard ECG signals.
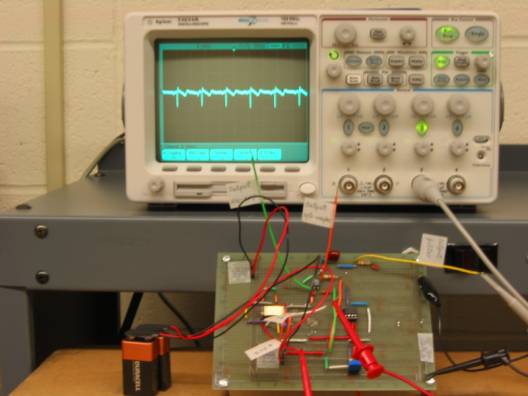
Figure 9 The ECG circuits
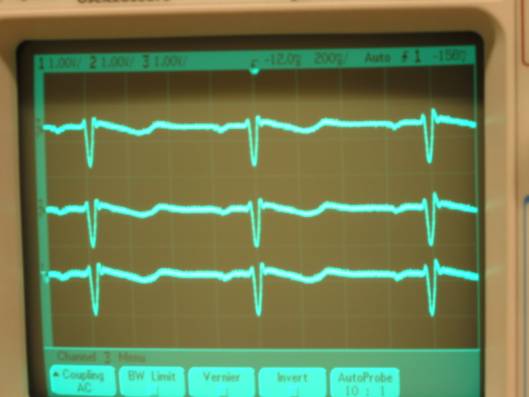
Figure 10 The ECG signals. The three signals are respectively probed from (1)In-Amp (2) Opto-Coupler (3) Filter.
[1]
Webster, John G., Medical Instrumentation:
Application and Design. 3rd
Ed. Philadelphia: W.B.
Saunders Company, 1998.
[2] AD624 dada sheet, Analog Device
[3] ST 741 Op Amp Data Sheet, ST Microelectronics.
[5]Shawn Charson ,"Home is where the ECG is" ,Amatenur Scientist
[7]Let's build an ECG amplifier
[8]Source of Biopotentials and Biopotential Amplifier